Auto-Translate
Toolbox Explained
How to use the toolbox to create heatmaps and log measurements

Instead of capturing light at a single location and moment in time, you can measure light across time and space using the logging or the heatmap tool.
You can open the toolbox on every measurement screen. All settings (light source, measurement type, unit, ePAR, etc.) also apply to the toolbox.
Heatmap

- Where your usable footprint actually is — and how large it really is.
- Whether you need to raise, lower, or add a light to cover your full canopy.
- How even your coverage is (uniformity), so you know whether plants at the edges are being shortchanged.
- Where to place your highest-light-demand plants versus seedlings or shade-tolerant crops.
How It Works
First, select your light source and swipe to the desired measurement unit on the main screen. Then, open the Heatmap tool inside the toolbox.
1. Configure the Heatmap
- Grid size — choose how many rows and columns you want to sample (for example 4×4 = 16 measurement points) – more points result in a finer and more detailed map.
- Dimensions — enter the real-world width and length of your grow area: The grid is drawn to scale whenever the area's proportions allow it; if it can't be matched exactly, you'll see a note.
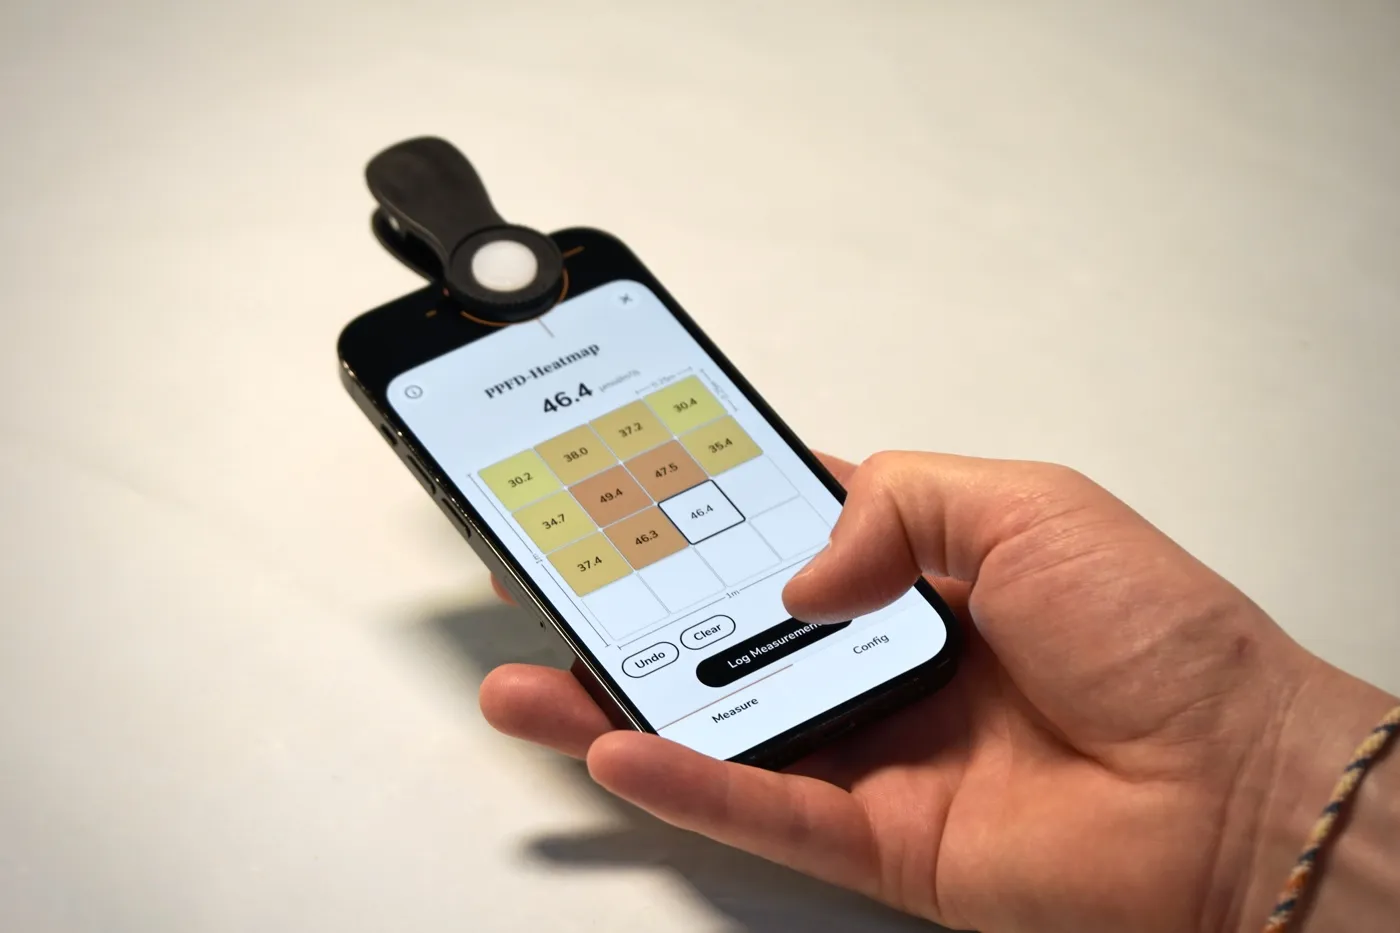
2. Measure Each Grid Cell
Place your device according to the highlighted cell in the grid, then tap "Log Measurement". A short beep confirms that the measurement for that cell has been successfully saved. The Heatmap tool will then guide you through the entire grid in a snake pattern. Important: Always take your measurements at the same height.
Use the "Log After" setting to delay the measurement by a few seconds to step out of the way. This ensures measurements reflect real lighting conditions, so e.g. your own body doesn't shade the sensor.
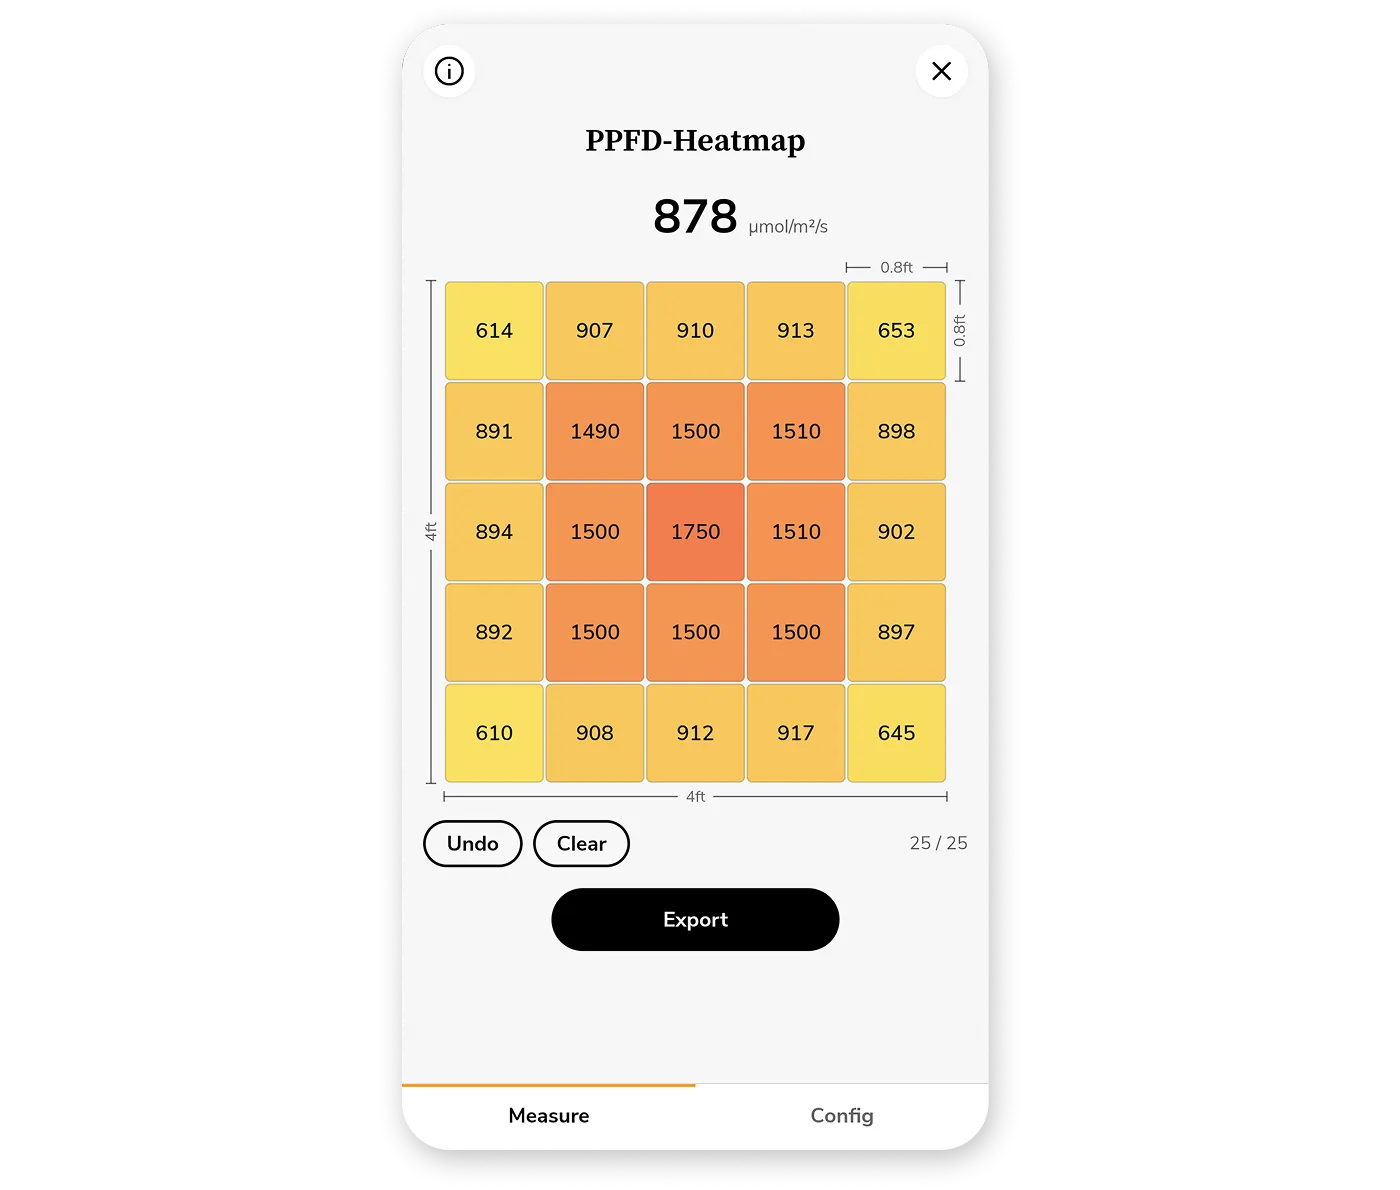
3. Review and Share Your Results
Once you have filled out the grid fully, export the heatmap as a shareable image. Add an optional subtitle and the height/distance to the lamp you measured at.
The exported heat map contains helpful statistics. Particularly relevant are the average and the uniformity. This metric indicates how evenly the light is distributed across the entire measured area. 100% means that every cell received the same amount of light, while lower values indicate greater differences between brighter and darker areas.
Save the export to keep a record to compare against next time you adjust your setup or share it with your grower community.
Logging

- Detect Warm-Up Drift: Observe how fixture output changes as lights warm up and reach operating temperature.
- Track Daily Light Exposure: Measure how much light plants actually receive over a defined period, from a few minutes to an entire photoperiod (the entire day).
- Compare Sessions: Record and compare measurements before and after changes to your setup, helping you evaluate adjustments with real data.
- Identify Trends and Anomalies: Spot gradual dimming, unexpected fluctuations, or other behaviors that would be difficult to recognize from individual readings alone.
How It Works
Select your light source and swipe to the desired measurement unit on the main screen. Then, open the Logging tool inside the toolbox.
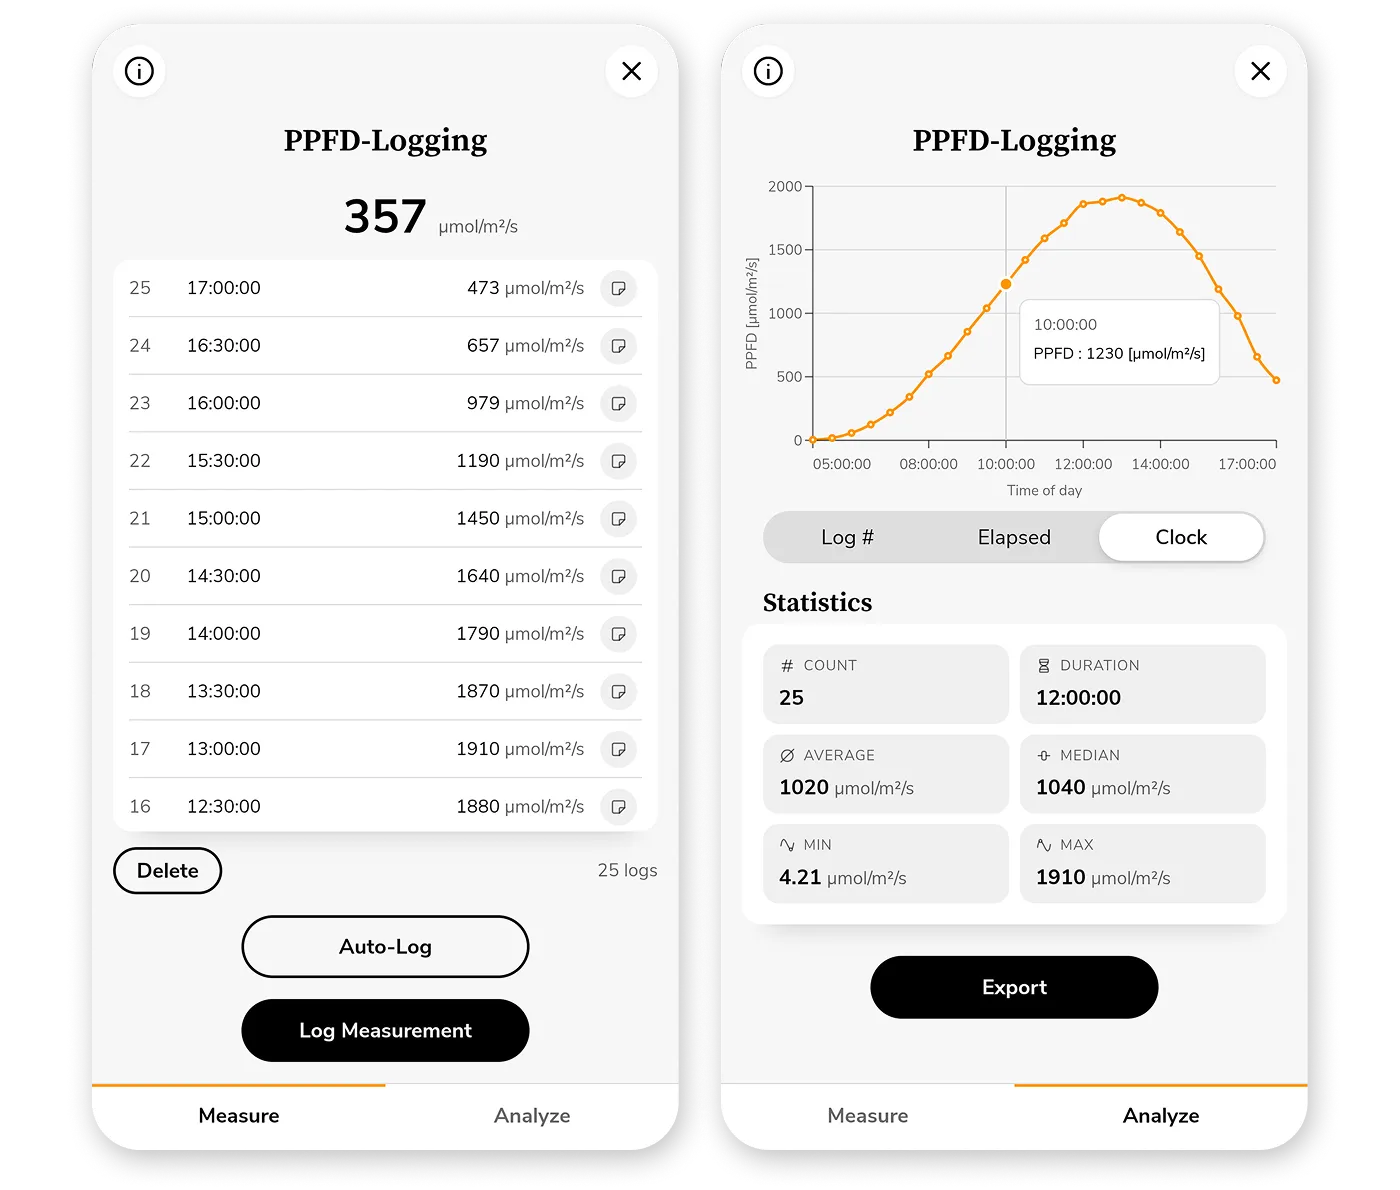
1. Record Measurements
Record measurements manually with "Log Measurement" or automatically using Auto-Log at regular intervals, from a few seconds to multiple days. During an Auto-Log session, keep your phone stationary and ensure it has enough battery power.
All logs are stored on your device and can be deleted individually or all at once. Add notes to document changes to your setup, environment, or observations.
2. Analyze
The Analyze section provides a chart that visualizes how values change over time. Pinch to zoom in the chart. The statistics below the chart summarize the key metrics of your data. For further analysis, export your logs as CSV or Excel spreadsheet.
Actual DLI
When measuring sunlight, the projected Daily Light Integral (DLI) shown on the main screen does not provide a meaningful value because it assumes that light intensity remains constant. Since sunlight naturally changes throughout the day, you need to log measurements over time to calculate the actual DLI.
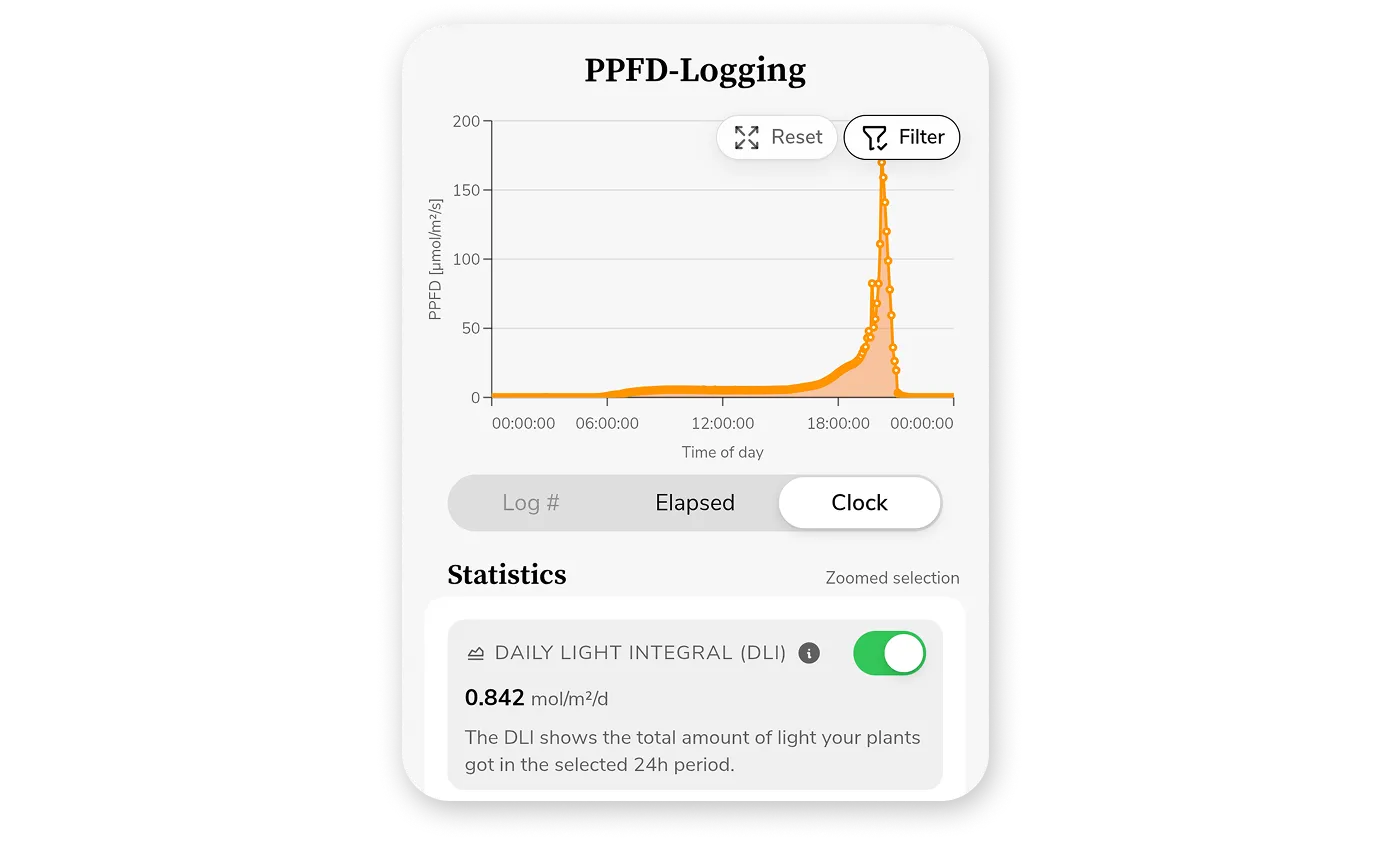
To do this, ensure you're in "PPFD-Logging" mode and start an Auto-Log that runs from sunrise to sunset (or simply set the "Stop Condition" to "Stop After 24 hours" to ensure the full day is captured). Choose a suitable logging interval, such as every 10 minutes (lower intervals lead to a more accurate measurement, but higher power consumption).
Place your device where your plants are, make sure it remains stationary throughout the recording, and ensure it has enough battery power. After the Auto-Log session is complete, open the Analyze section and enable the DLI in the statistics.
Battery Saver
The Battery Saver automatically activates after 15 seconds of inactivity during Auto-Log sessions longer than 2 minutes. It turns the screen black, reduces the display brightness to the minimum, and only activates the sensor shortly before each scheduled measurement to minimize power consumption.
For the most reliable results, enable Do Not Disturb mode on your device to prevent notifications from interrupting the session. It's also recommended to turn on your device's built-in battery saver to reduce background activity. If you're unsure whether the battery will last for the entire session, keep your device connected to a charger.