Auto-Translate
We've got something special to share — and it's built on the two features you asked for most. Say hello to the Toolbox: a new home inside Photone that combines our community's top two requests into one place — Logging and PAR / PPFD Heatmaps.
Six years of getting the light right
Before we show you the new toys, a quick word on why we took our time.
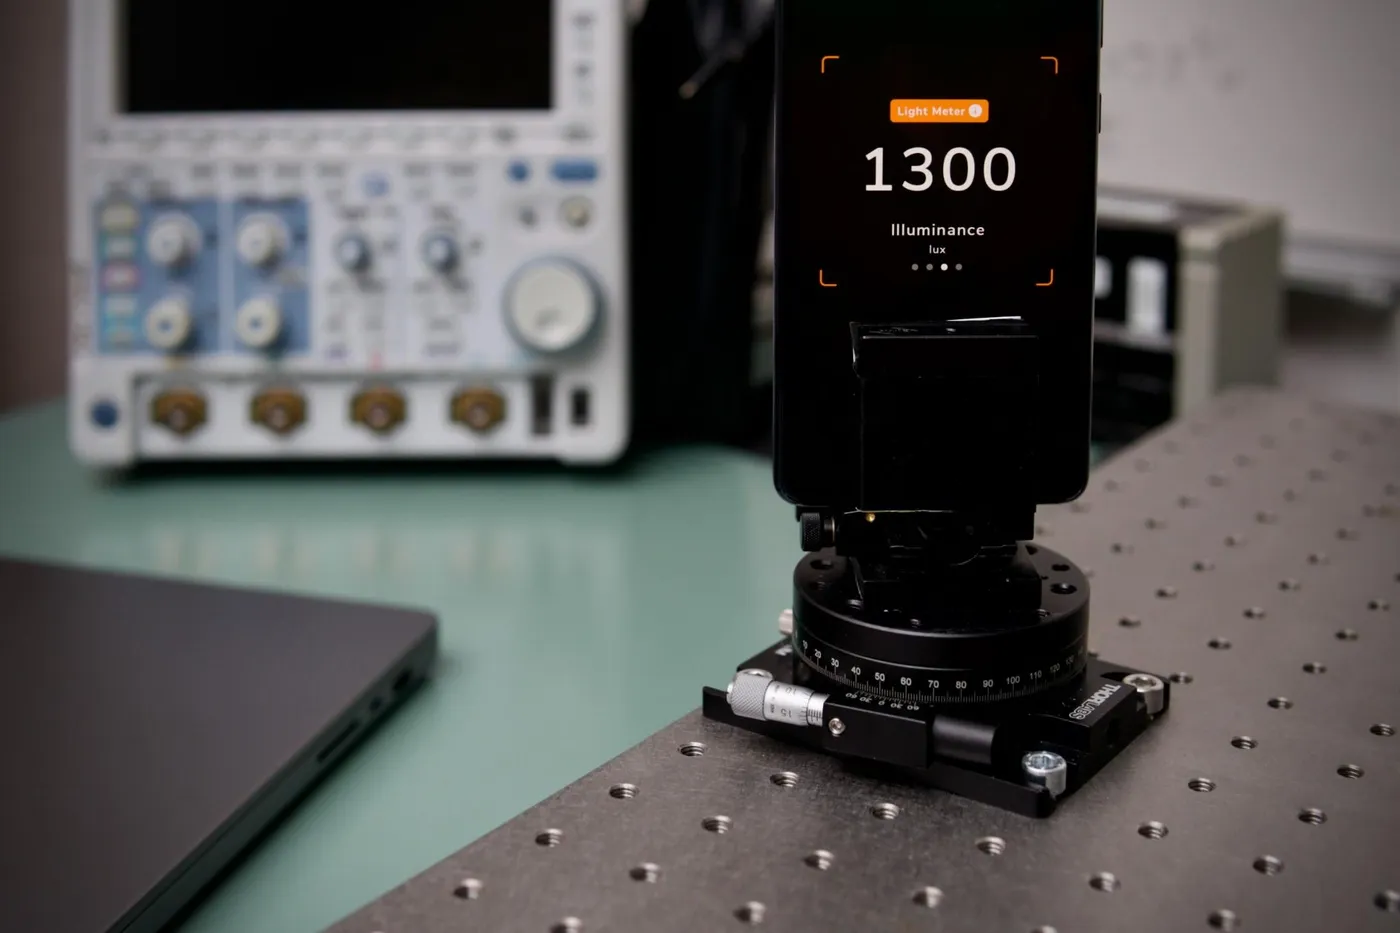
For the last six years, we've been on a single mission: to build the only truly accurate light meter app out there. That's not a tagline — it's the result of real work. We partnered with optics scientists at the Zurich University of Applied Sciences (ZHAW) and spent hours upon hours of testing in the lab to get our measurements right.
Here's what makes Photone different from every other app you've tried:
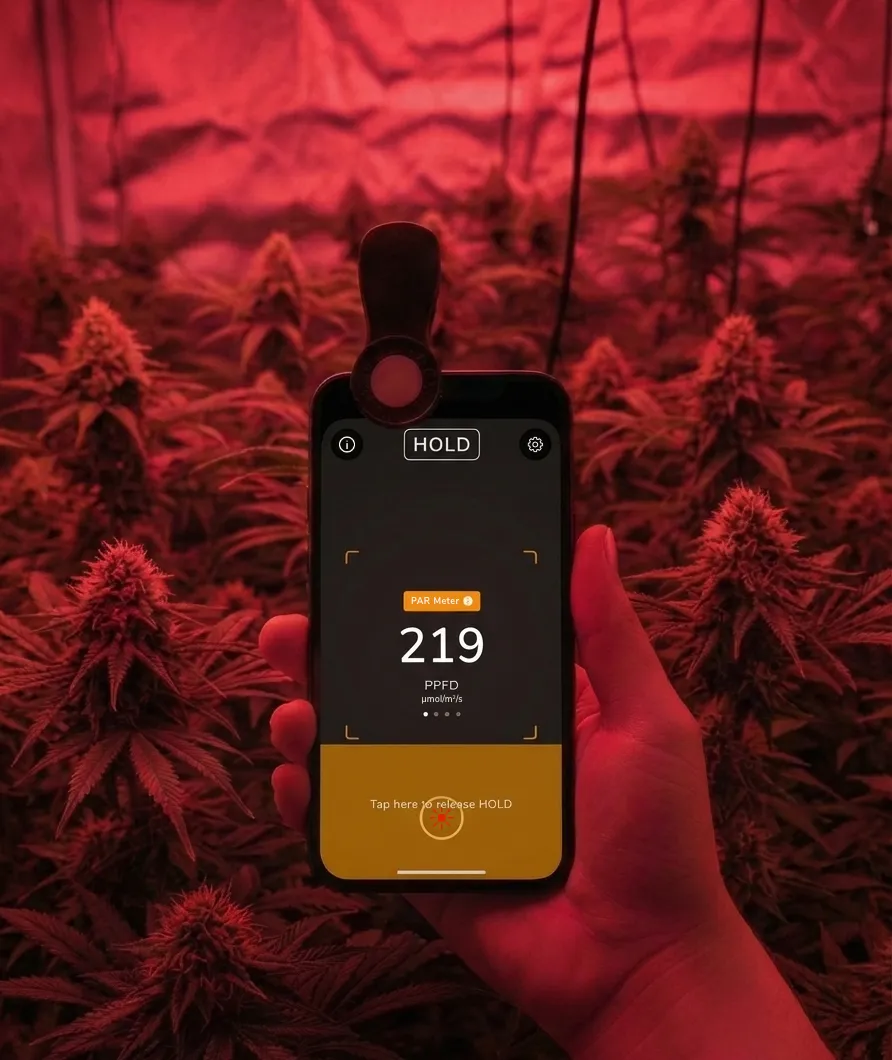
- We use your phone's camera to process RAW image data
- We've pre-calibrated the app for every single iPhone and many Android devices, individually using lab-grade equipment. (See the full list of all pre-calibrated devices)
That foundation is exactly why these new features matter: a heatmap or a log is only as good as the readings behind it. Ours hold up.
Now: the features you've been asking for
With accuracy locked in, we've finally found the time to focus on building the features you've been asking for. They live right inside the app — open Photone (ensure you have the latest update), and you'll find the Toolbox on the main screen below the settings button.
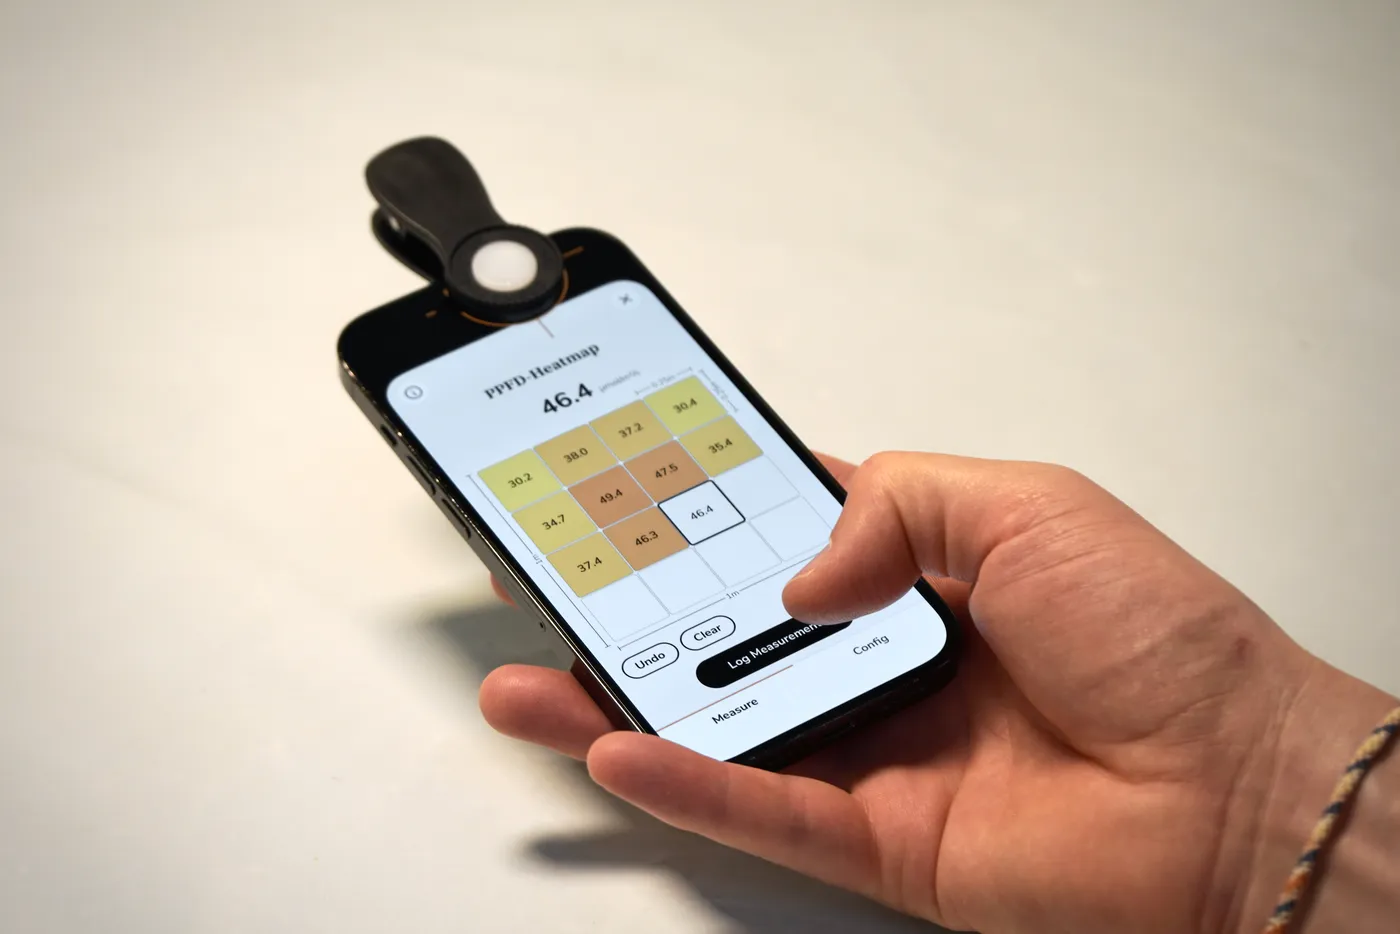
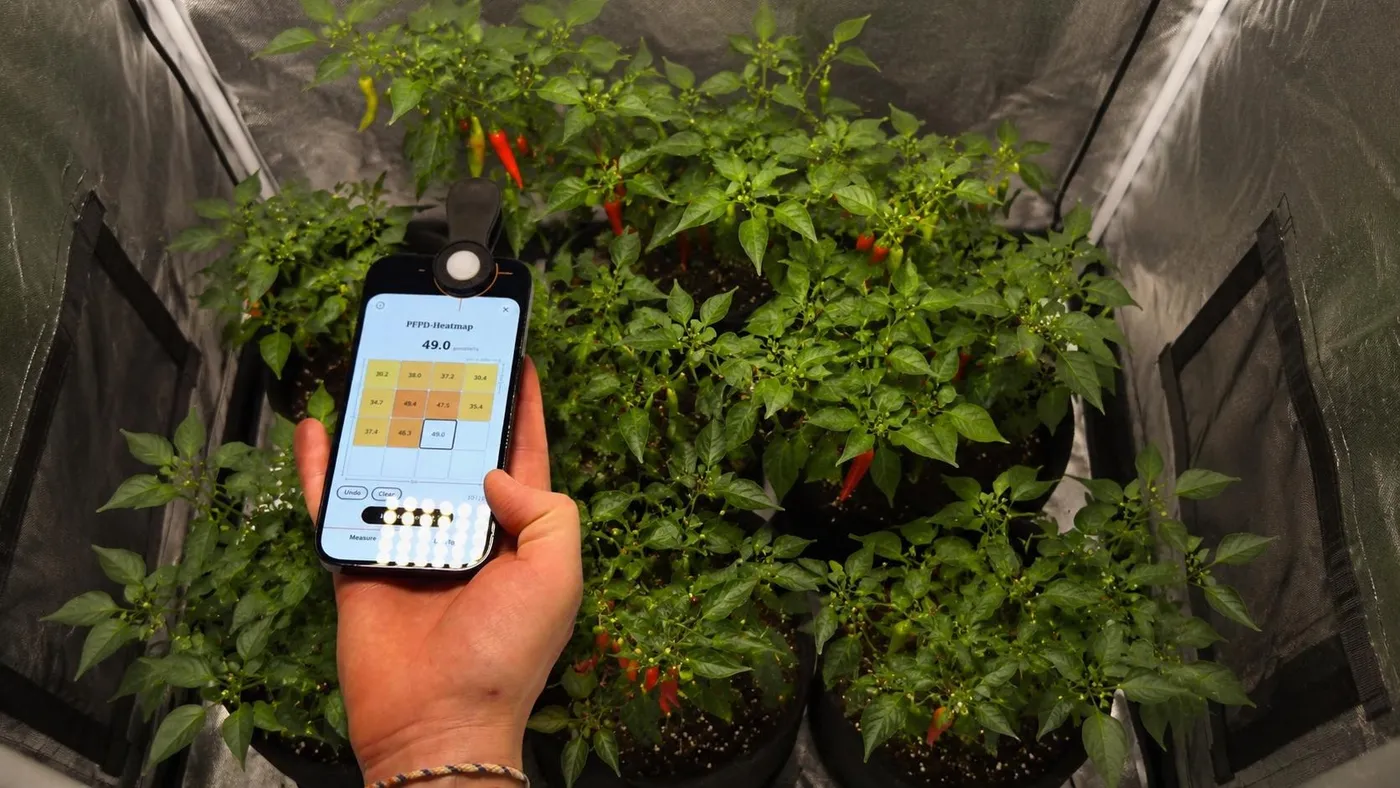
PAR / PPFD Heatmaps
Map your grow light's real footprint in minutes. Walk a simple grid over your growing area, log a reading in each cell, and Photone turns it into a beautiful, color-coded heatmap — drawn to your tent's true proportions, complete with min, max, average, and uniformity stats. It's the honest picture of your coverage that no manufacturer chart can give you. Read the full article:

📈 Logging
Stop trusting a single number and start watching how your light actually behaves. Log readings manually or hands-free with Auto-Log, then chart the trend right in the app — find your fixture's true warmup time, track light across the day, or run your own experiments. Export everything to CSV or Excel for a deeper dive. Read the full article:

Go try it — and tell us what you think
Both features support PPFD, DLI, ePAR, lux and foot-candles, and they're waiting for you in the Toolbox right now.
- Open Photone (grab the latest version from here)
- Tap into the Toolbox on the main screen
- Build your first heatmap or start a logging session
Then come share your results, feedback, and experiences with the rest of us in our new Reddit community →. These features exist because you asked for them — so tell us what you'd like to see next.
Thanks for growing with us. 🌱
— The Photone Team