Auto-Translate
A grow light's footprint — the area it actually covers at a usable intensity — is the first thing that decides how many plants you can grow under it. Get the footprint right and every plant sits in light it can use. Get it wrong and the plants at the edges stretch, stay small, and never catch up to the ones in the center.
The problem: a single number on a spec sheet ("1000 µmol/m²/s") tells you almost nothing about that footprint. Light intensity is highest directly under the lamp and falls off toward the edges, and how fast it falls off depends entirely on your setup. To actually see your coverage, you need a map — and that map is called a heatmap.
This article shows you the simplest way to create one yourself, for free, with a device you already own.
What Is a PAR Map / PPFD Heatmap?
A PPFD heatmap (also called a PAR map or light map) is a grid laid over your growing area where each cell is color-coded by how much light reaches it. Red colors mark the high-intensity zone under the lamp; yellow colors show where the light drops off toward the corners.
In one glance it tells you:
- Where your usable footprint actually is — and how big it really is.
- How even your coverage is (uniformity), so you know whether plants at the edges are being shortchanged.
- Where to place your highest-light-demand plants versus seedlings or shade-tolerant crops.
- Whether you need to raise, lower, or add a light to cover your full canopy.
It turns an invisible, three-dimensional pool of light into a picture you can act on.
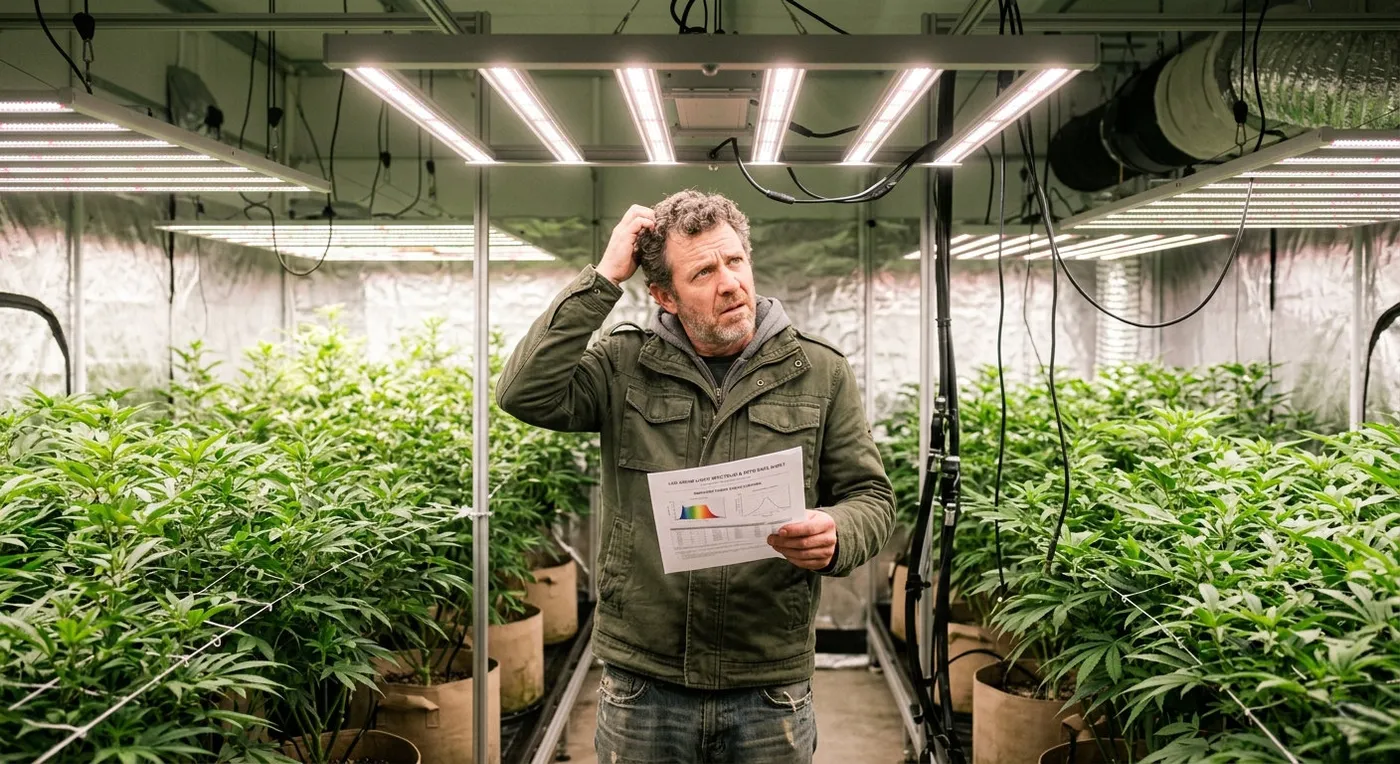
Why You Can’t Just Trust the Manufacturer’s Heatmap
Renowned grow light brands publish a PPFD chart for their fixture. It's a useful starting point — but it describes their test conditions, not your tent. Almost everything that matters is different in a real grow:
- Reflective walls. A Mylar-lined tent bounces light back onto the canopy and lifts your edge numbers far above an open-room measurement.
- Mounting height. PPFD changes dramatically with distance. A chart measured at 18" looks nothing like your light hung at 12" or 24".
- Tent size and shape. Your 4×4 (or 2×4, or 3×3) crops and reshapes the footprint the manufacturer measured in open space.
- Multiple lights. Two or more fixtures overlap, and the combined map is not something any single-light chart can show.
- Lamp age and driver dimming. LEDs degrade over time, and running at 60% or 80% power moves every number on the chart.
The only map that reflects your grow is one you measure in your grow. The good news: that's now easy.
The Best Way: Measure It Yourself With Photone
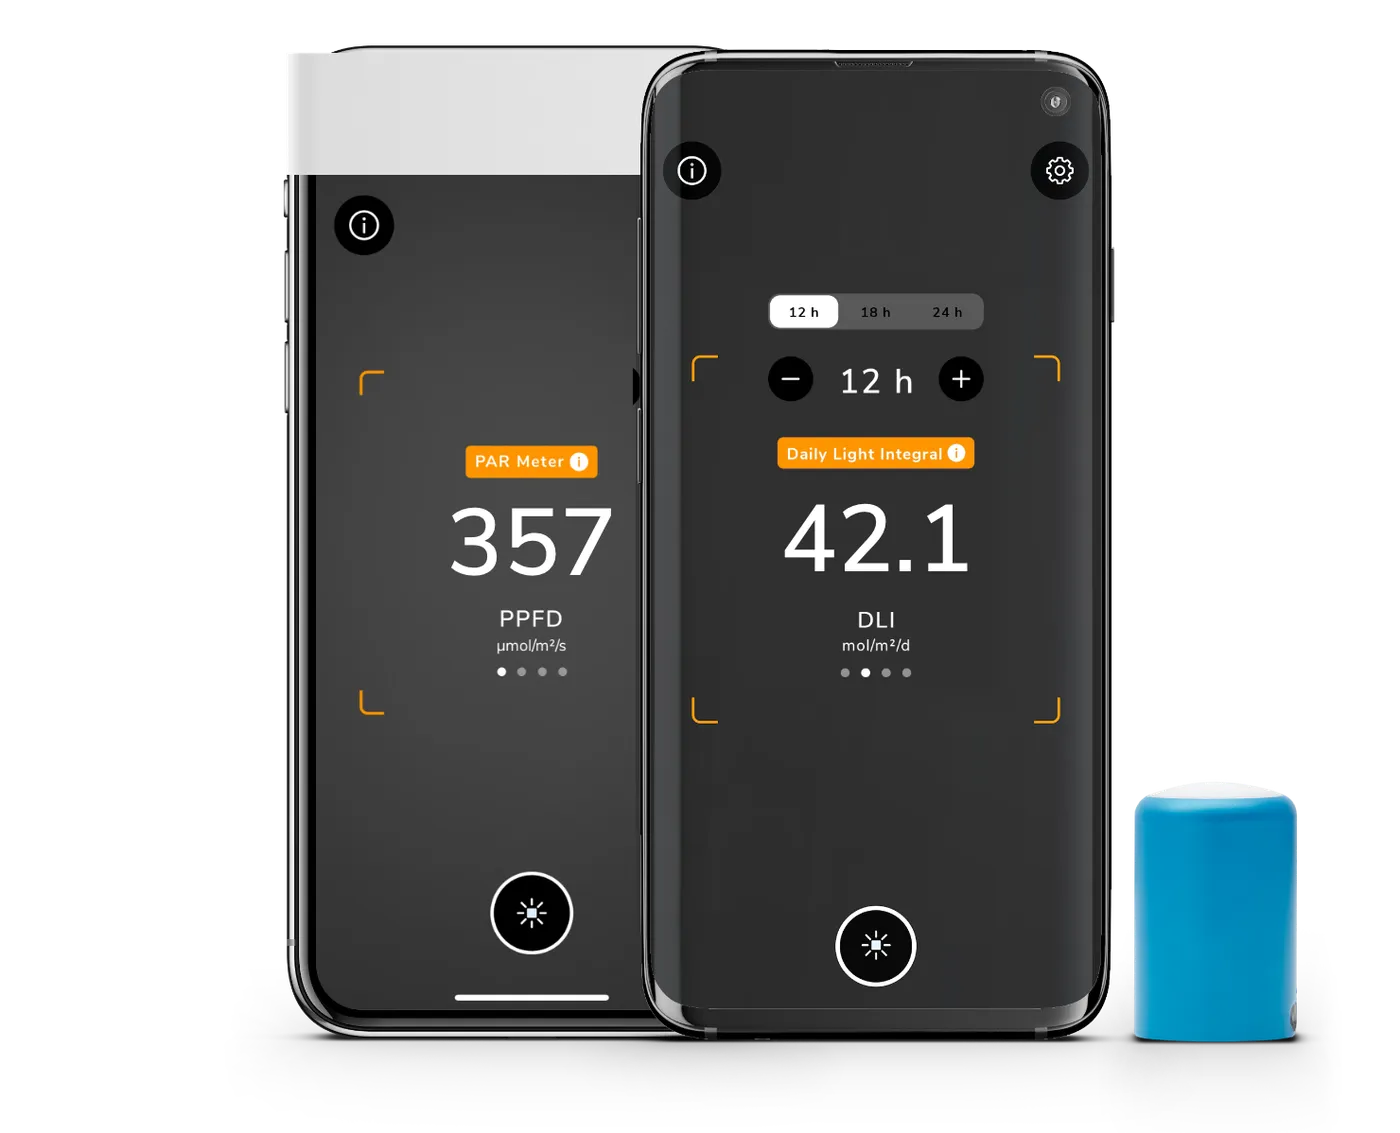
Photone - Grow Light Meter turns your phone into a calibrated light meter and lets you build a professional-looking heatmap from your own measurements — no dedicated PAR meter required.
Here's how it works:
1. Set Up Your Grid
First, select your light source and swipe to desired measurement unit on the main screen. Then, open the Heatmap tool inside the Photone toolbox and tell it about your space:
- Grid size — choose how many rows and columns you want to sample (for example 4×4 = 16 measurement points). More points means a finer, more detailed map.
- Dimensions — enter the real width and length of your growing area in meters or feet.
Because you give it the real dimensions, the heatmap is drawn at the correct aspect ratio. A 2×4 tent looks like a 2×4 tent — not a forced square — so the picture matches what you're actually looking at.
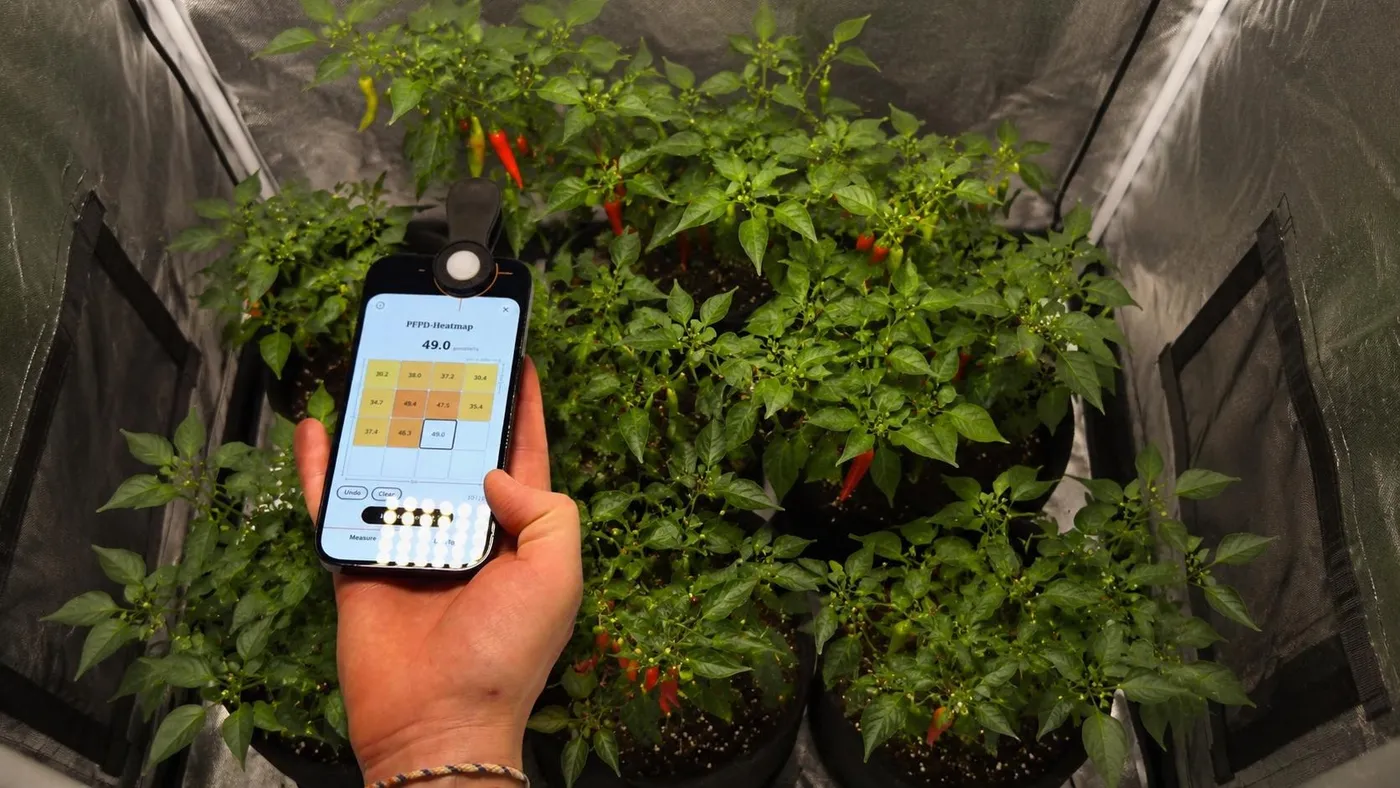
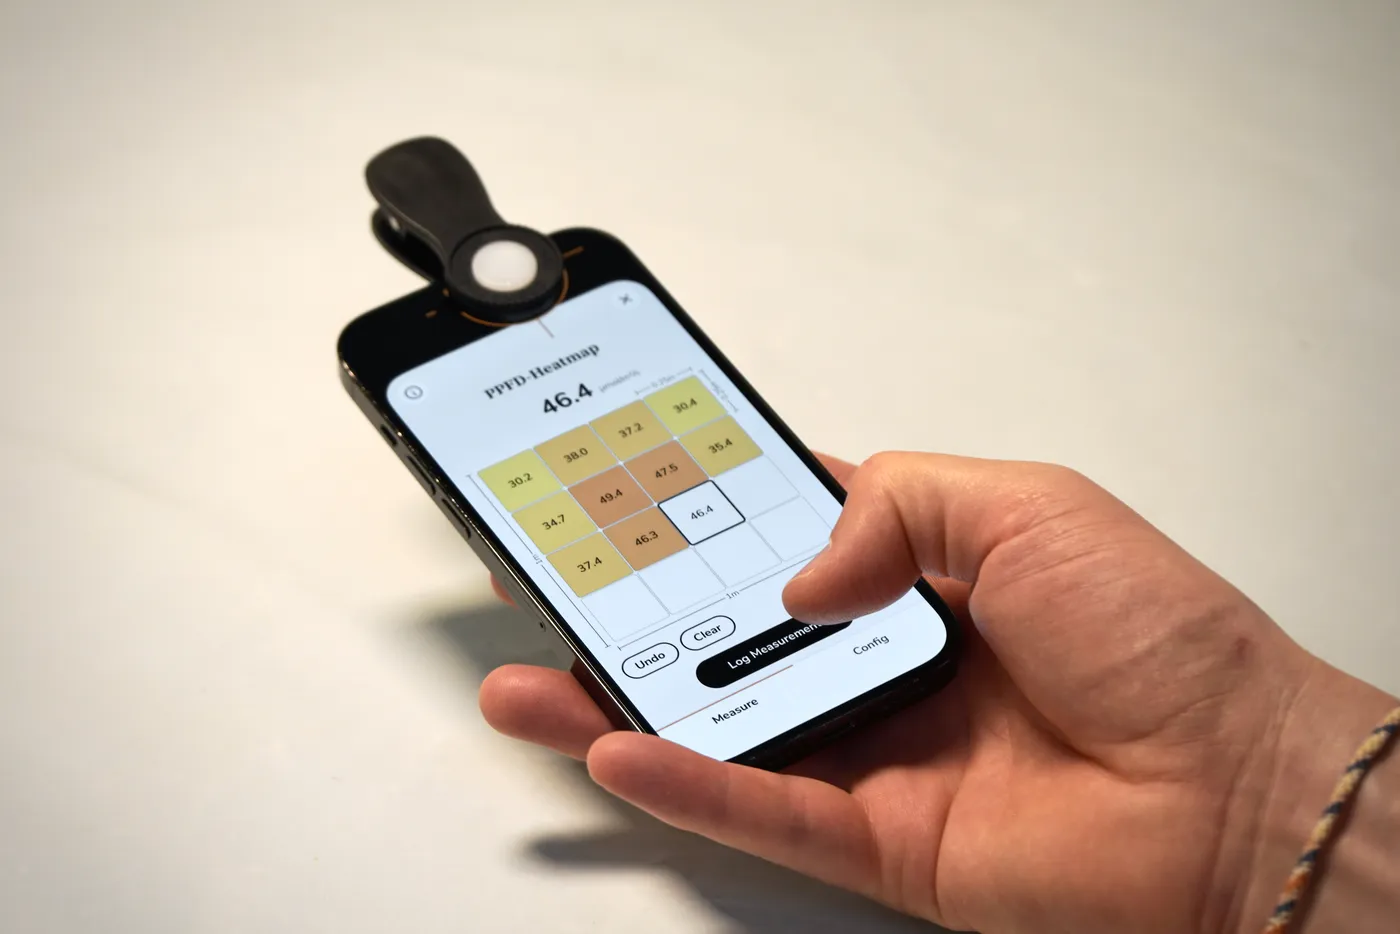
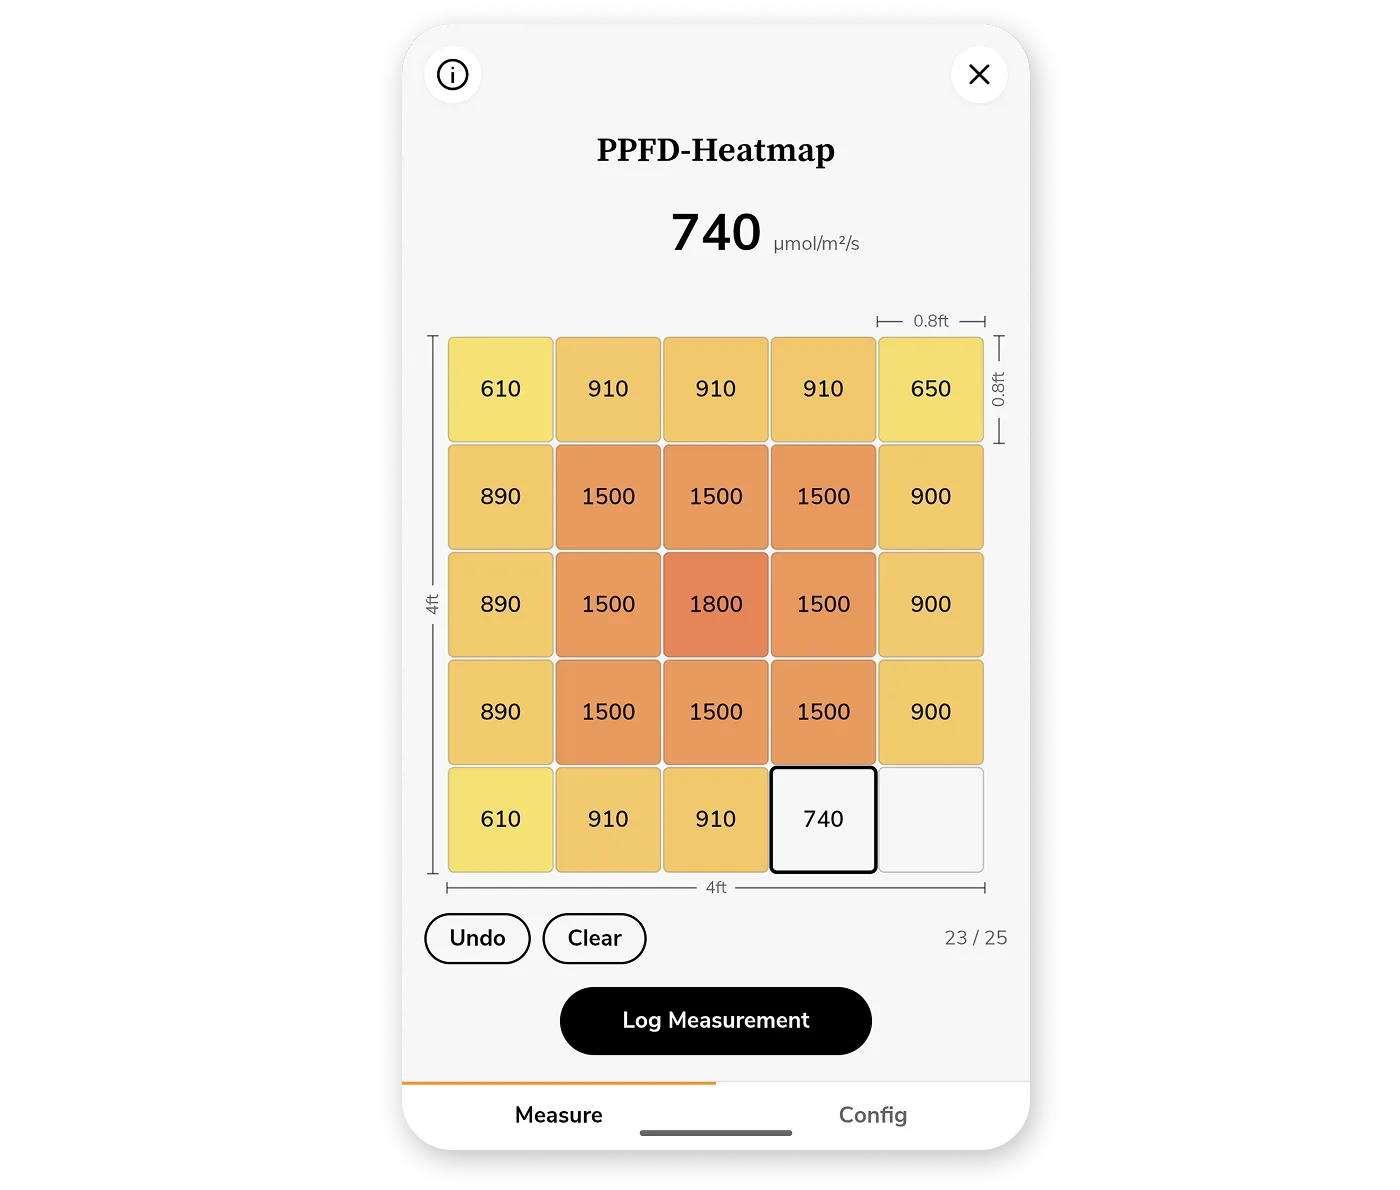
2. Walk the Grid and Log Each Point
Photone guides you through the grid in a snake pattern, highlighting the next cell to measure so you never lose your place. Hold your phone at canopy height over each cell and tap Log Measurement.
There's even an optional "Log After" delay: set a few seconds, press the button, and step out of the way so your own body doesn't shade the sensor before the reading is captured. It's a small touch that makes a real difference to accuracy.
A live counter shows your progress (e.g. 9 / 16), and you can undo or re-measure any cell at any time.
3. Export Your Heatmap
When every cell is filled, export a clean, shareable image of your map. The export includes:
- A color-coded grid rendered to your tent's true proportions.
- An optional title/subtitle and the height/distance to the lamp you measured at — so the map is self-documenting.
- A stats row with min, max, average, and uniformity, the numbers growers actually compare.
Save it, share it with your grower community, or keep a record to compare against next time you adjust your setup.
Works for Every Kind of Light Measurement
Different growers care about different units. Photone's heatmap supports them all:
- PPFD — instantaneous photosynthetic photon flux density, in µmol/m²/s. The classic "PAR map" unit.
- DLI — Daily Light Integral, in mol/m²/d. How much total light your plants receive over a full day.
- Illuminance — in lux or foot-candles (fc), for when you're assessing light for humans.
And because Photone comes with an ePAR switch, you can flip your PPFD and DLI readings to the extended PAR range (400–750 nm) that accounts for far-red light's contribution to photosynthesis — so your map reflects the full spectrum your plants actually use. Whether you want a PAR map, an ePAR map, a DLI map, or a lux map, it's the same simple workflow.
What Good Looks Like: Reading Your Map
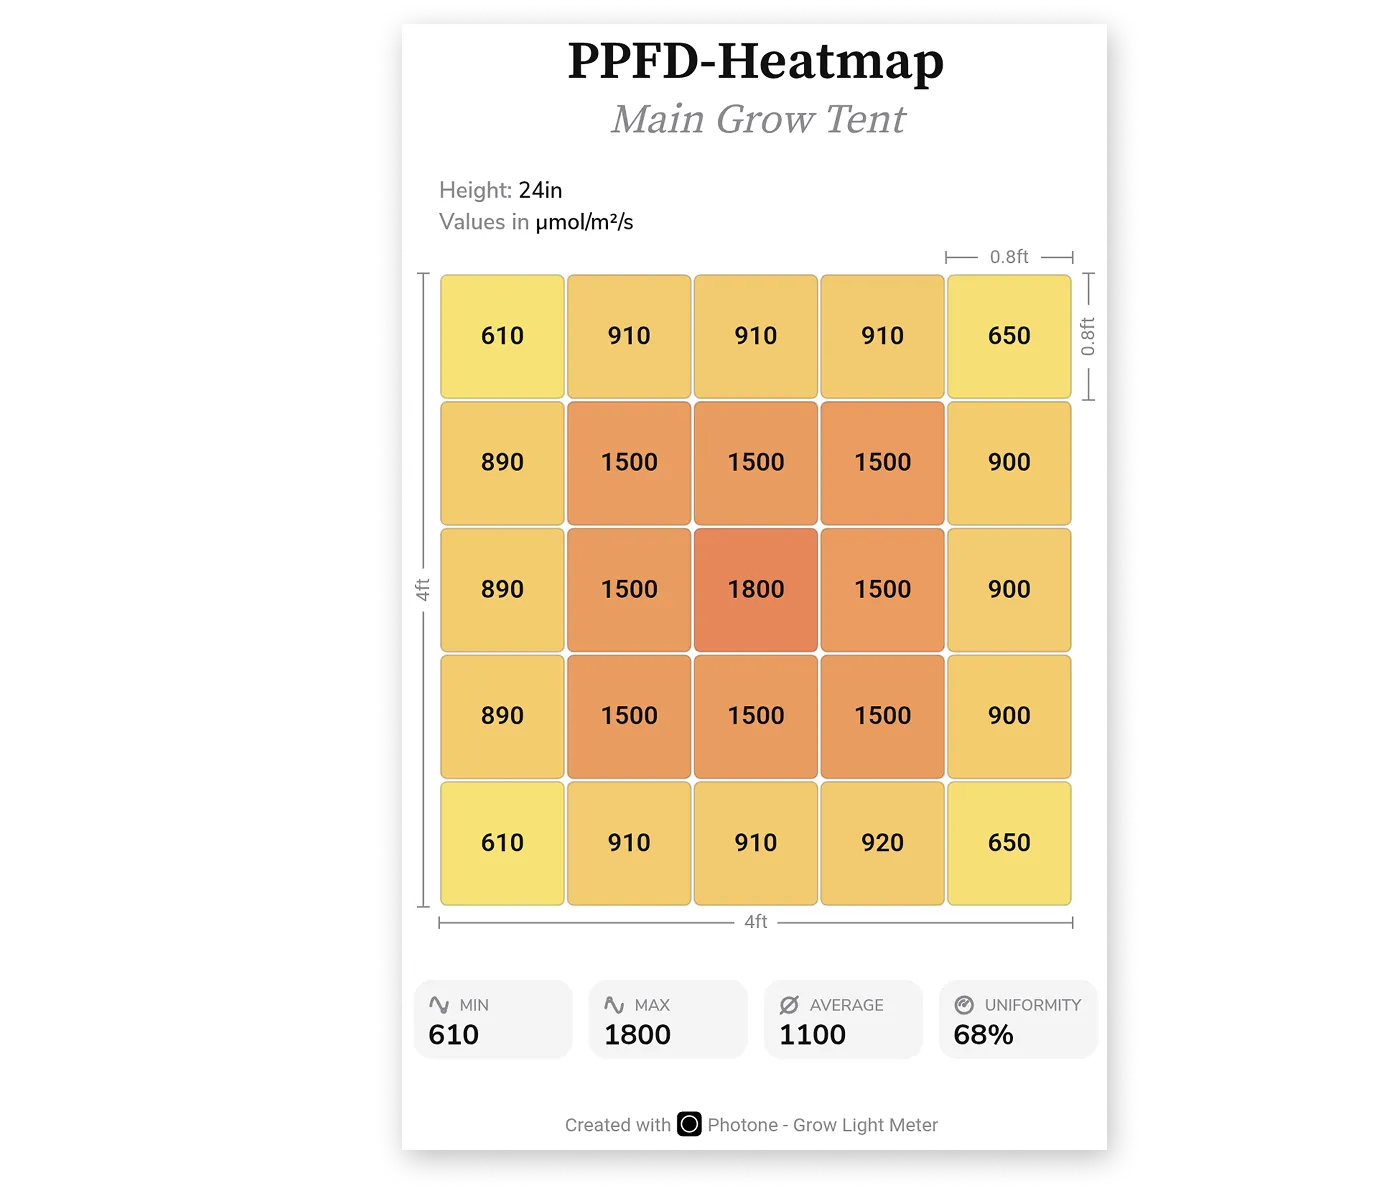
Once you have exported your heatmap, two numbers do most of the work:
- Average PPFD tells you whether the overall intensity suits your crop and growth stage (seedlings, veg, and flower each want different levels).
- Uniformity tells you how evenly that light is spread. High uniformity (numbers close to 100%) means your edge plants grow as well as your center plants; low uniformity (closer to 0%) means you have some hotspots — it's time to raise the light, add a fixture, or rotate plants through the bright zone.
If the average is right but uniformity is poor, you're feeding the middle and starving the corners — and your yield is leaving with those corner plants. The map makes that obvious in seconds.
FAQ
Do I need a dedicated PAR meter to make a PPFD heatmap? No. A decent handheld PAR meter can cost hundreds of dollars. Photone comes pre-calibrated for your specific device so you can measure PPFD, DLI, and ePAR — and build a full heatmap — for a fraction of the price of a handheld meter.
How many measurement points should I use? A 4×4 grid (16 points) is a great default for a single fixture. Go finer for larger tents, multi-light setups, or when you want to pinpoint hot spots and dead corners.
What's the difference between PAR and ePAR? PAR covers 400–700 nm. ePAR (extended PAR) widens that to 400–750 nm to include far-red light, which research shows contributes to photosynthesis. Photone lets you switch between them so your map matches the standard you work to.
Can I map two or more lights together? Yes — and that's exactly when a self-measured heatmap beats a manufacturer chart. Just measure the combined light over your grid and the overlap shows up in the map.
Is the heatmap to scale? The cell colors are scaled to your data range and the grid is rendered at the true aspect ratio of the dimensions you enter. So a rectangular tent actually looks rectangular. Note: for a better usability, the aspect ratio may be slightly adjusted — if that's the case, a note will show below the grid.
Map Your Grow Today
Stop guessing where your light lands. Measure your real footprint, see your true coverage, and grow more even, more productive plants. Turn your phone into a light meter and create your first PPFD heatmap in minutes. Download Photone - Grow Light Meter: