Auto-Translate
A single light reading is a snapshot. It tells you what the light is doing right now, at one spot — and nothing about how it behaves over time. But almost every interesting question about a grow light is a question about change: How long until it stabilizes? How much does the intensity drift across the day? How much light is that pane of glass stealing?
To answer those, you don't need a bigger number — you need a line on a chart. That's what a logging tool gives you: log your readings over seconds, minutes, or hours, watch the trend, and finally see how your light actually behaves.
This article shows you how to turn your phone into a logger for plant lighting, the kinds of things it reveals, and how to export your data for a deeper dive.
What Is Light Logging — and Why It Beats a Single Reading
Logging means recording a series of measurements, each stamped with the exact time it was taken, and plotting them as a trend line. Instead of one value you have to trust, you get the shape of the data — the rise, the dip, the drift, the spike.
That shape is where the insight lives. A flat line means a stable, trustworthy light. A slow climb means a fixture that's still warming up. A sudden dip the moment you lean in means you are casting a shadow you can't even see. None of that is visible from a single number — all of it is obvious on a chart.
What You Can Learn by Logging Your Light
Once you start logging, your grow stops being a guessing game. A few things growers discover almost immediately:
- How your light changes through the day. In a greenhouse or near a window, sunlight rises, peaks, and falls — and clouds punch holes in the curve as they pass. Run a long log and you'll see the real daily light profile your plants live with, not the one you assumed.
- The invisible shadow you cast. Stand close to the sensor — even off to the side — and watch the value drop. Your body blocks and absorbs light you'd never know you were losing. Logging makes the case for stepping away (or using a tripod) when you measure.
- Reflections that quietly boost readings. Hold a white panel or move near a reflective tent wall and the value climbs. Logging shows you exactly how much your environment adds — and warns you when a reading is flattered by reflections rather than real canopy light.
- Whether cleaning (or covering) the glass is worth it. Log the light reaching your plants, clean a dirty greenhouse pane or skylight, and log again — the difference is right there on the chart. The same trick measures exactly how much the dirty window, a shade cloth, or extra layer of glass steals from your canopy.
These aren't lab experiments — they're five-minute checks that change how you set up your space.
Detect Your Fixture's Warmup Time
Here's the one that surprises people most. Many grow lights don't hit their rated output the instant you switch them on. This is especially true for HID/HPS and Fluorescent fixtures, but it affects LEDs too as their drivers and diodes heat up and this impacts their efficiency.
If you measure 30 seconds after flipping the switch, you're measuring a light that isn't done warming up — and every number you record is wrong.
Here's a simple experiment to verify this yourself. Download Photone - Grow Light Meter for free on your phone and select the Logging tool inside the toolbox:
- Start an Auto-Log run the moment you power on the fixture.
- Let it record automatically every minute.
- Then check the chart in the analytics section.
The point where the line goes flat is your warmup time. Now you know exactly how long to wait before any serious measurement.
Run Real Experiments
A logger turns "I think" into "I measured." Here are some experiments worth running once you have the Photone app up and running:
- Distance falloff. Start a log, then slowly raise or lower the lamp. The curve shows you how fast intensity drops with height (light falls off sharply with distance) — so you can dial in the perfect hanging height for your target PPFD instead of guessing.
- Daylight + supplemental timing. Log a full day in a greenhouse to see when natural light dips below your crop's needs — that's exactly when supplemental lighting earns its keep, and the chart makes the case for you.
- Before / after anything. A cleaned reflector, a different mounting angle, a dimmer setting — log before, change one thing, log after, and let the measurements settle the argument.
- Stability and flicker checks. A noisy, jumpy line instead of a clean flat one can reveal a failing driver or an unstable power supply before it costs you a crop.
Because every entry is timestamped, you can also add a note to any reading ("raised light 5 cm", "cleaned glass", "cloud passed") so the story stays attached to the data.
Hands-Free with Auto-Log, or One Tap at a Time
You're never chained to your phone. The Logging tool works two ways:
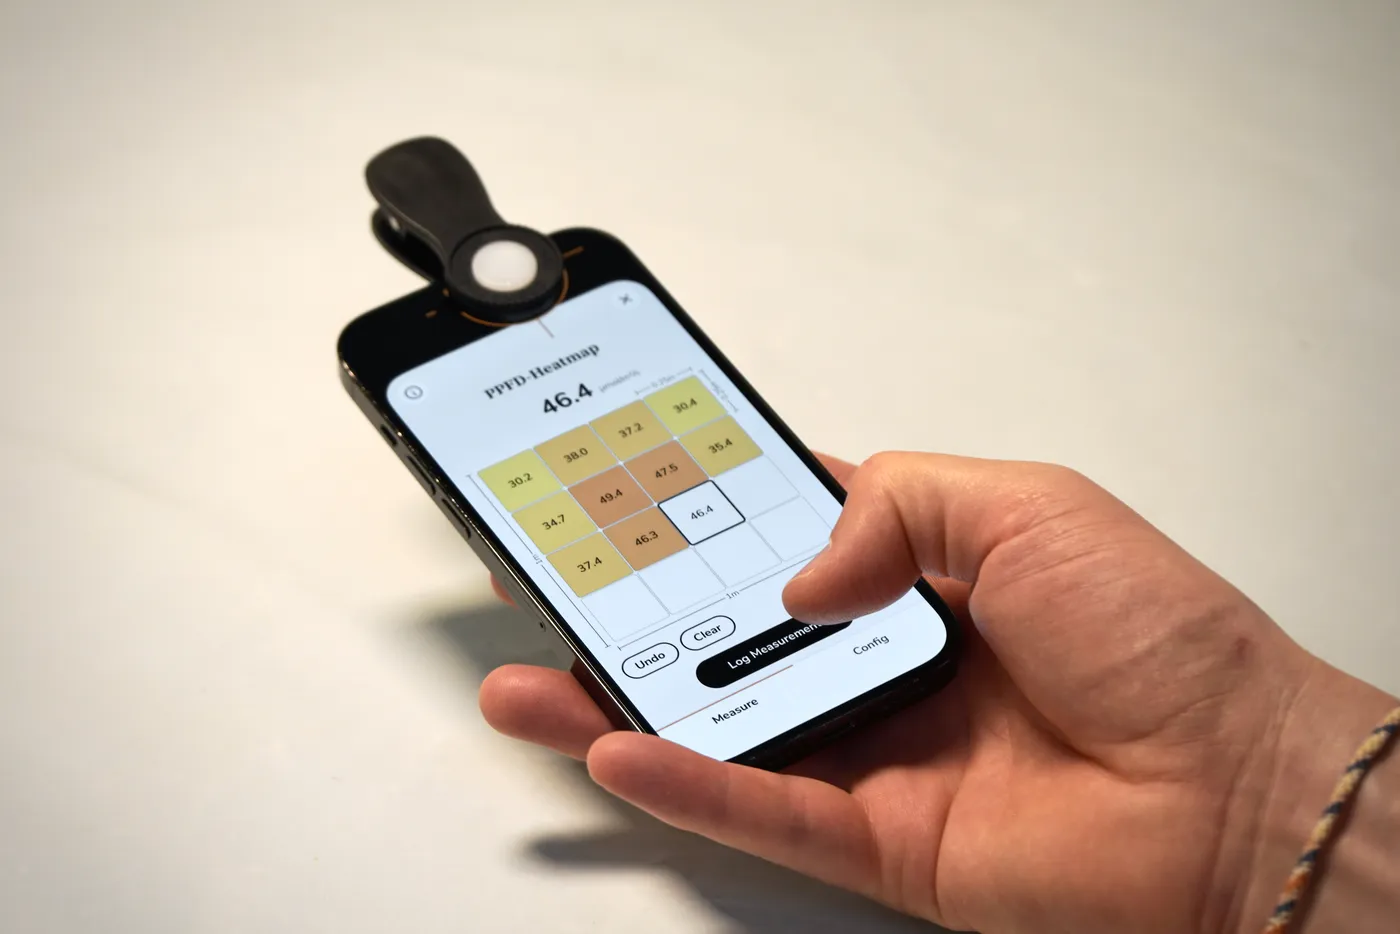
- Manual — tap Log Measurement to capture the current reading whenever you want a deliberate data point.
- Auto-Log — set it to record automatically every N seconds or minutes, and stop after a chosen number of logs or a set duration. Perfect for unattended runs: warmup curves, all-day greenhouse profiles, or long stability tests.
Either way, each entry lands in a clean, timestamped list you can scroll, annotate, or prune.
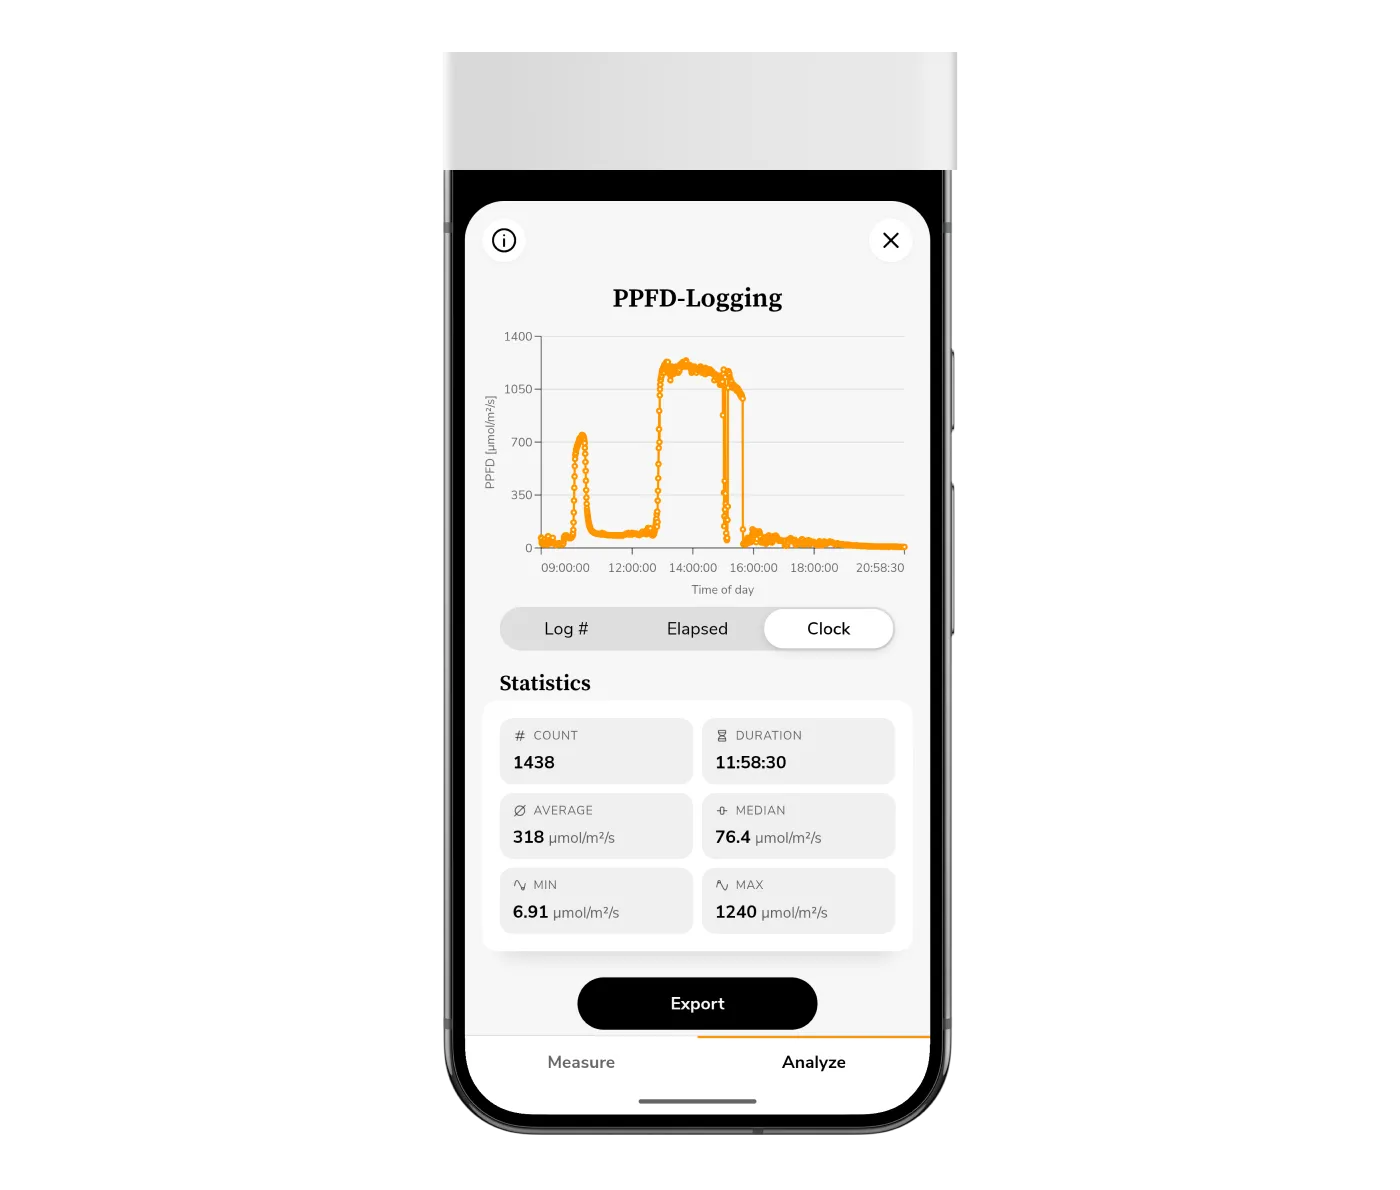
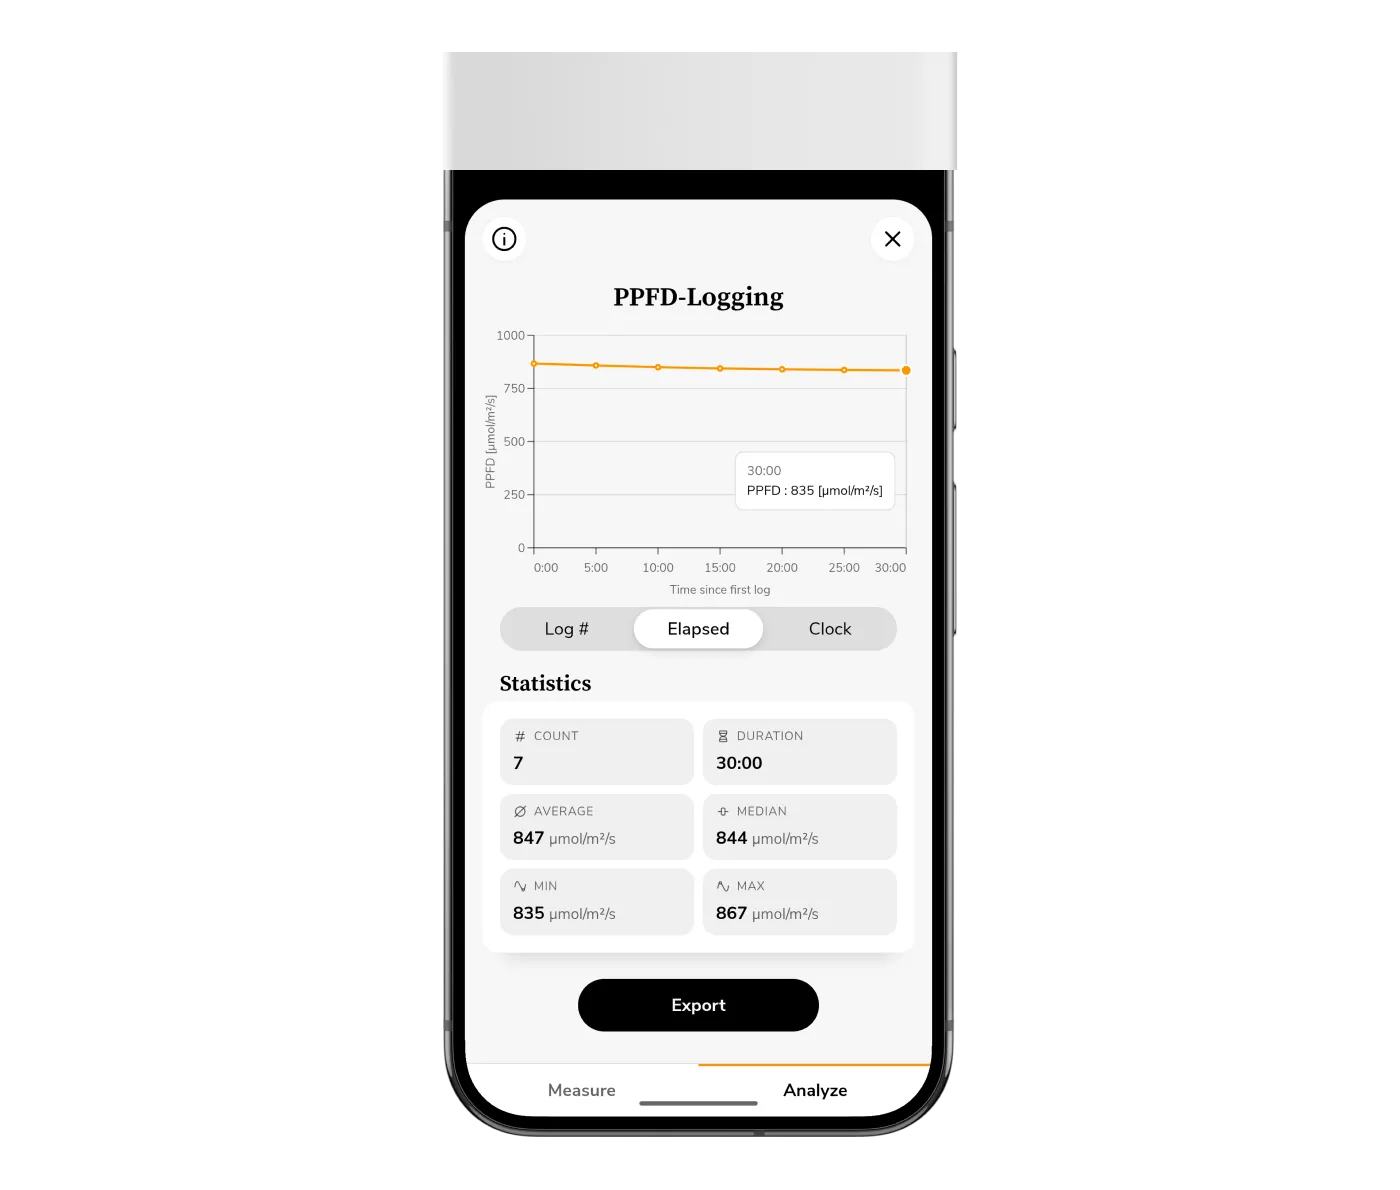
Analyze the Trend Right in the App
Switch to the Analyze tab and your logs become a live chart. You can plot the x-axis three ways depending on the question:
- Log # — just the sequence of readings.
- Elapsed — time since your first log (ideal for warmup and experiment runs).
- Clock — actual time of day (ideal for daylight and greenhouse profiles).
Below the chart, Photone computes the numbers that matter at a glance: count, duration, average, median, min, and max. So you don't just see the trend — you get the summary statistics for free, with no spreadsheet required.
Export Your Data and Deep-Dive in Excel
When you want to go further, export the whole session as a CSV or Excel (.xlsx) file. Each row carries the log number, the measurement, the exact timestamp, and your note — clean, structured, and ready for analysis.
From there it's your playground: build your own charts, calculate rolling averages, integrate readings into a DLI total, compare multiple sessions side by side, or drop the data into whatever tool your workflow already uses. The in-app chart answers the quick questions; the export is there for the deep dives.
Works for Every Kind of Light Measurement
Whatever unit you work in, you can log and chart it:
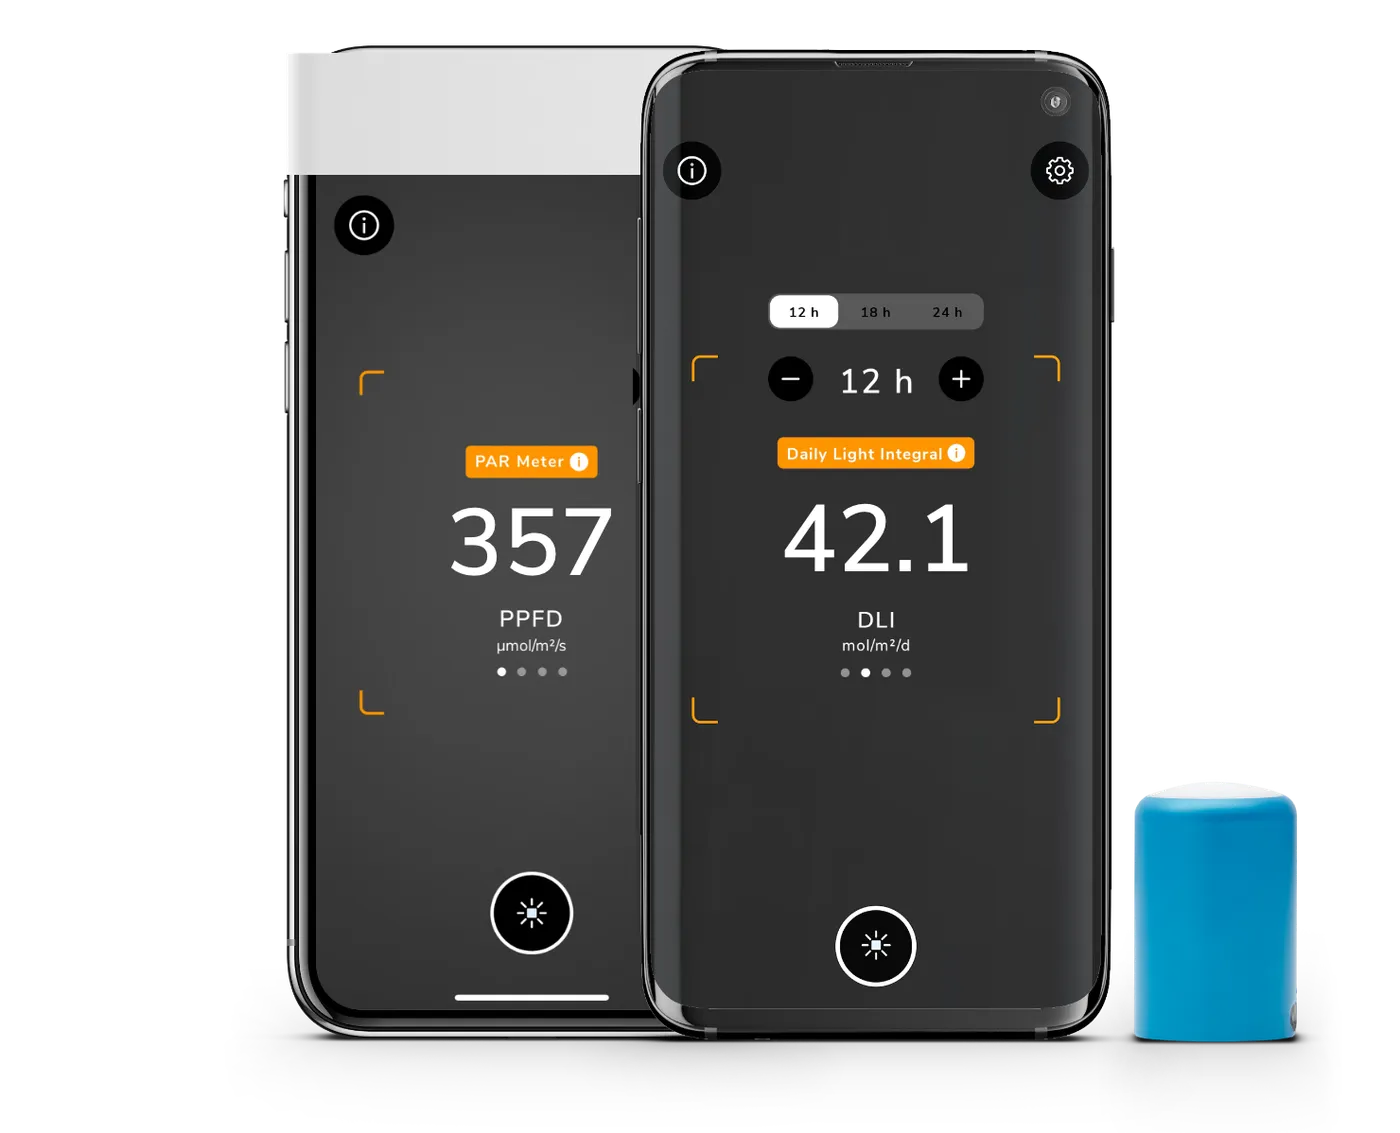
- PPFD — photosynthetic photon flux density, in µmol/m²/s. The classic "PAR" unit.
- DLI — Daily Light Integral, in mol/m²/d.
- Illuminance — in lux or foot-candles (fc), for when you're assessing light for humans.
And with Photone's ePAR switch, your PPFD and DLI logs can flip to the extended PAR range (400–750 nm) that accounts for far-red light's contribution to photosynthesis — so your trend reflects the full spectrum your plants actually use.
You can create logs for all supported measurement values: all settings you've configured on the main screen (light source, measurement type, unit, ePAR, etc.) carry over to the toolbox Logging tool.
FAQ
Do I need a dedicated PAR data logger? No. Standalone logging meters are expensive and clumsy. Photone comes pre-calibrated for your specific device, so you can log PPFD, PAR, DLI, ePAR, and lux — and chart it — with the phone already in your pocket.
How often can the app log automatically? Auto-Log records on a fixed interval you choose, from a few times per second up to once every several minutes, and stops after the number of logs or the duration you set. That covers everything from fast warmup curves to multi-hour daylight profiles.
Can I log light over a whole day? Yes — set a long Auto-Log run (or log manually through the day) and plot it against clock time to see your full daily light profile, clouds and all. Just ensure your device has enough battery (attach a charger to play it safe).
What format is the export? CSV or Excel (.xlsx), with log number, measurement, timestamp, and note in separate columns — ready to open in Excel, Google Sheets, or any analysis tool.
What's the difference between PAR and ePAR? PAR covers 400–700 nm. ePAR (extended PAR) widens that to 400–750 nm to include far-red light. Photone lets you log in either.
Start Logging Your Light Today
Stop trusting a single number. Log your light, watch how it really behaves, and let the chart show you the shadows, the warmup, the drift, and the gains you've been missing. Turn your phone into a PPFD / PAR / lux logger in minutes.